
Mental Health App — a Usability Study
Overview
The Optimism Mood Chart is a well-rounded mood tracker that allows general public, professionals and mental health patients to track their mood using different digital platforms to enter and obtain their mood data. Upper management reviewed quarterly figures on the application’s metrics. They noticed a decline in new user acquisitions, lower mood entries, and technical supports high volume for users wanting to download their mood tracking history. We have been tasked with evaluating the information architecture for registering, entering daily mood data, and locally saving an individual’s mood history.
Our team wanted to understand how the public interprets the existing website and their experience with this specific mood tracker. In order to enhance its reputation and impress the upper management, the team conducted usability testing with the general public to see their performance on their actual website to accessing the actual application to log and view their mood data.
Our team gathered information based on the current website through a usability study. The goals of this study were to:
- Assess the overall effectiveness of http://www.findingoptimism.com for different types of users performing basic, common tasks.
- Identify obstacles in converting future users to sign-up and use optimism apps.
- Identify obstacles in a users entering mood data.
- Identify obstacles with the user finding past mood entries.
Methods
Research Questions
Our usability study tried to answer the following questions:
Identify Signup Location
- Can the user find the register page?
Signup Process
- Can users register for the website application successfully?
- What obstacles do users encounter when registering an account?
- What were some expectations that the users have during the signup process?
Mood Entry
- What obstacles do users encounter when adding a mood?
- What were some expectations that the users have when adding a mood?
Saved Mood Data
- What obstacles do users encounter when viewing past moods?
- What were some expectations that the users have when viewing past moods?
- Can the user retrieve their mood data as a PDF successfully?
Quantitative
- How long does it take to create an account?
- How long does it take to enter a mood?
- How long does the user take to retrieve their mood data?
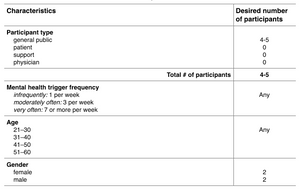
Participant Characteristics
We identified four types of participants who need an application to support and track their mental health: general public (self-help), patients (mental health), support (family, friends, etc), and clinicians (mental health professionals).
General Public: An individual that is not under a physician's care, but desires to self track and document their changes in mood. Their main objective is to track and discover what triggers their change in mood.
Patient: an individual with any degree of a mental illness. They are currently under the observation and care of a personal physician, psychiatrist, or psychologist. These participants require the application to self track and document their daily mood changes so they may discover the cause of their mental health triggers.
Support: an individual (family member, another patient, etc) who helps support the patient with their mental health. These participants will be able to monitor their loved ones entries and help support them when certain triggers cause mental health issues.
Clinician: a physician or mental health professional who has direct care over the patient. This participant’s role is to monitor and give medical advice based on the information entered into the application by the patient.
Methodology
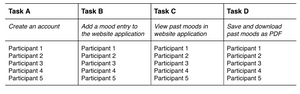
Our usability study was exploratory and focused on a between-subject design with four tasks (Table 2). Participants were categorized into one of four groups, but this study concentrated on the general public group. We collected qualitative and quantitative data about our participant’s performance and success/error rates.
Session outline and timing
The test sessions were 45 minutes long. The moderator used 15 minutes of each session for pre-test introductions and post-test debriefing interviews. The sessions took place in person or remotely using Webex. The pilot testing was conducted in-class with a laptop, moderator and two observers.
Pre-test arrangements
Have the participant:
- Review consent form
- Answer background screener questions
Introduction to the session (2 minutes)
Discuss:
- Participant’s experience with usability studies and focus groups
- Importance of their involvement in the study
- Moderator’s role
- Room configuration, recording systems, observers, etc.
- The protocol for the rest of the session
- Thinking aloud
Background interview (3 minutes)
Discuss the participant’s:
- Experiences in mood tracker applications
- Experiences with mood swings or therapy experience
Tasks (30 minutes)
Participants started their session at the application’s homepage. They were asked to think aloud during their four tasks. They completed the ‘Create an Account’ process with a provided email and password for entering and retrieving information throughout the website.
Post-test debriefing (10 minutes)
- Ask broad questions to collect preference and other qualitative data
- Follow-up on any particular problems that came up for the participant
- Ask to rate their satisfaction of the test
Task Findings
Each usability study was approximately 45 minutes in length. After the participants signed the informed consent, we asked a series of questions about their background on mental health, mood tracking, and technology usage. We then observed our participants perform four tasks which were recorded and timed for post analysis. Finally, we asked each participant four post-test questions which they ranked according to their performance of each task.
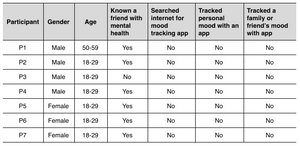
Our participant demographics (Table 3) were made up of seven participants (N=7), four male and three females. The majority age range was between 18-29 with six out of seven participants responding that they knew of someone with a mental health issue. However, none of our participants have ever searched the Internet for mood tracking software, nor had they used a mood tracking software to track themselves, a friend, or family member.
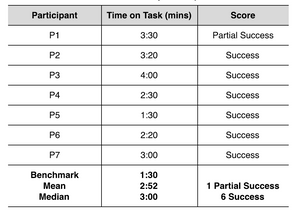
Objective 1 - Signup Process
We observed our participants perform a task which required them to register for the application within one minute. During our observations, we hoped to answer how long it takes to create an account and could our participants register for the application successfully (Table 4). We concluded with a series of post-task questions which helped answer what obstacles or expectations did our users encounter when registering an account.

Objective 2 - Mood Entry
We observed the participants perform a task which required them to login to the application and enter a mood entry for October 7 within one minute and thirty seconds. During our observations, we hoped to answer how long it takes to enter a mood and could our participants add a mood trigger successfully (Table 5). We concluded with a series of post-task questions which helped answer what obstacles or expectations did our users encounter when adding a mood entry.
Objective 3 - Viewing Mood Data
We observed the participants perform a task which required them to view all mood entries for the month of October within fifteen seconds. During our observations, we hoped to answer how long it takes to view monthly mood entries and could our participants view monthly mood entries successfully (Table 6). We concluded with a series of post-task questions which helped answer what obstacles or expectations our users encountered when viewing monthly mood entries.
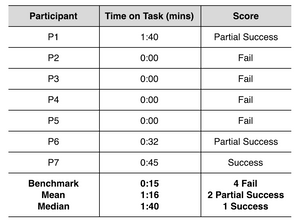
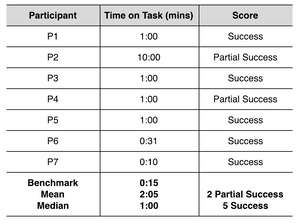
Objective 4 - Export Mood Data
We observed the participants perform a final task which required them to export the mood data from the application as a portable document format (PDF) within fifteen seconds. During our observations, we hoped to answer how long it takes to print out a report and could our participants export to PDF successfully (Table 7). We concluded with a series of post-task questions which helped answer what obstacles or expectations did our users encounter when exporting the report to PDF.
Discussions
The usability study was exploratory and focused on a between-subject design with 7 participants, 6 in the 18-29 age group and one in the 51-59 age group. Most participants acknowledged knowing someone with a mental health disorder, but could not relate to using a mood tracker application. The test included four tasks with a series of pre and post-task questions. Tasks included registering for the application, logging into the application to enter mood data, retrieving mood data for the month, and exporting monthly mood data as a PDF.
Raw Data Handling
The responses of seven participants were collected and summarized into a spreadsheet after finishing the usability testing. The spreadsheet was composed of participant information and task questions. The responses were filled into relative questions. Finally, our team conducted an overall analysis of time of task, score, task satisfaction, and participants’ comments to deliver a categorized finding list.
Categories of Findings
In order to present the usability issues clearly, the team grouped all the issues based on the analysis.
- Navigation How the website directed the user to get the destination (Table 8)
- Terminology What words the user would use (Table 9)
- Visual Design The design detail of the website (Table 10)
Severity Ratings
Then each assigned a severity rating based on the following details.
0 – Don’t agree that this is a usability problem
1 – Cosmetic problem
2 – Minor usability problem
3 – Major usability problem; important to fix
4 – Usability catastrophe; imperative to fix
Findings
For each finding, the team listed the detail of the finding, cause, severity, user’s comments, test results, short-term and long-term recommendation.
Major findings include:
- The Optimism Mood Chart includes an extensive amount of information for users to read and took some time to absorb all the information
- There are no major registration buttons visible on the homepage
- The information included on the site did not use familiar terms
Favorable findings include:
- The the UI of the mood tracking application is very similar to the flow of how a medical professional would fill out their chart
- The visual charts of the mood tracker application really helps to see the mood patterns clearly
Based on our findings and observations, our team developed the following recommendations. Short term recommendations address quick fixes such as register button clarity, reduction of unnecessary links, clarification of terms, and the creation of style guides to unify the application’s UI. Long term recommendations address global issues that require further research. These items require card sorting or surveying of users to restructure items like branding, website content, help documentation, and navigation.
Documentation